
Features
Sort Reels by Views Analytics Dashboard Export Data Competitor Analysis Performance Score Hashtag Analytics
Resources
Best Posting Times Engagement Calculator Go Viral on Reels Best Hashtags Guide Instagram Insights View All Resources
Company
About Contact
Install Free
Summarize with AI: Claude ChatGPT Share

What Is the IShort Analytics Dashboard?

An Instagram Reels analytics dashboard is a single view that turns raw Reel data into decisions: what to post, when to post it, and which hashtags and audio actually drive views. IShort's dashboard is a free Chrome extension that builds this view for any public account in 2026 — no business account switch, no $79/month SaaS fee, and it works without your Instagram login (you sign in with Google, never with your Instagram credentials). It shows views, engagement rate, best posting times, top hashtags, duration and audio breakdowns, and outlier scores for every Reel. Install once, open any /reels/ page, click the extension icon.

IShort Dashboard vs Native Instagram Insights

The two tools answer different questions. Native Instagram Insights shows private metrics (reach, watch time, shares) but only for your own professional account. IShort reads public reel data, so it works on any public account — including competitors — and adds aggregate views the native app lacks.

IShort Dashboard Instagram Insights
Accounts covered Any public account (yours or competitors') Your own account only
Data source Public reel data (views, likes, comments, duration, hashtags, audio, captions) Private account data (reach, watch time, shares, demographics)
Account type required None — works with personal accounts Business or Creator account
Aggregate analysis Heatmaps, scatter plots, hashtag rankings, CSV export Per-post metrics, limited trends

The dashboard is organized as a horizontal carousel with 7 distinct slides, each focusing on a different aspect of your Reels performance:

Slide What It Shows Availability
1. Performance Overview Performance Score (0-100), key metrics, engagement trend chart All plans (Free included)
2. Views vs Engagement Scatter Interactive scatter plot showing high/mid/low performers All plans (Free included)
3. Best Posting Times 7x8 heatmap showing avg views by day and time block All plans (Free included)
4. Hashtag Performance Top 8 hashtags by avg views, engagement %, usage count All plans (Free included)
5. Best & Worst Performers Side-by-side cards showing your top and bottom Reels All plans (Free included)
6. Duration & Audio Insights Short vs Medium vs Long Reel performance; Original vs Licensed audio All plans (Free included)
7. Quick Tips AI-generated tips: best posting hour, best duration, audio recommendation All plans (Free included)

Every plan gets the full dashboard — all 7 slides, including hashtag performance and AI tips. The plans differ only by how many reels you can analyze per month: Free covers 500 reels/month, Hobby ($10/month) 10,000, and Creator ($29/month) unlimited. No blurred previews, no feature paywalls.

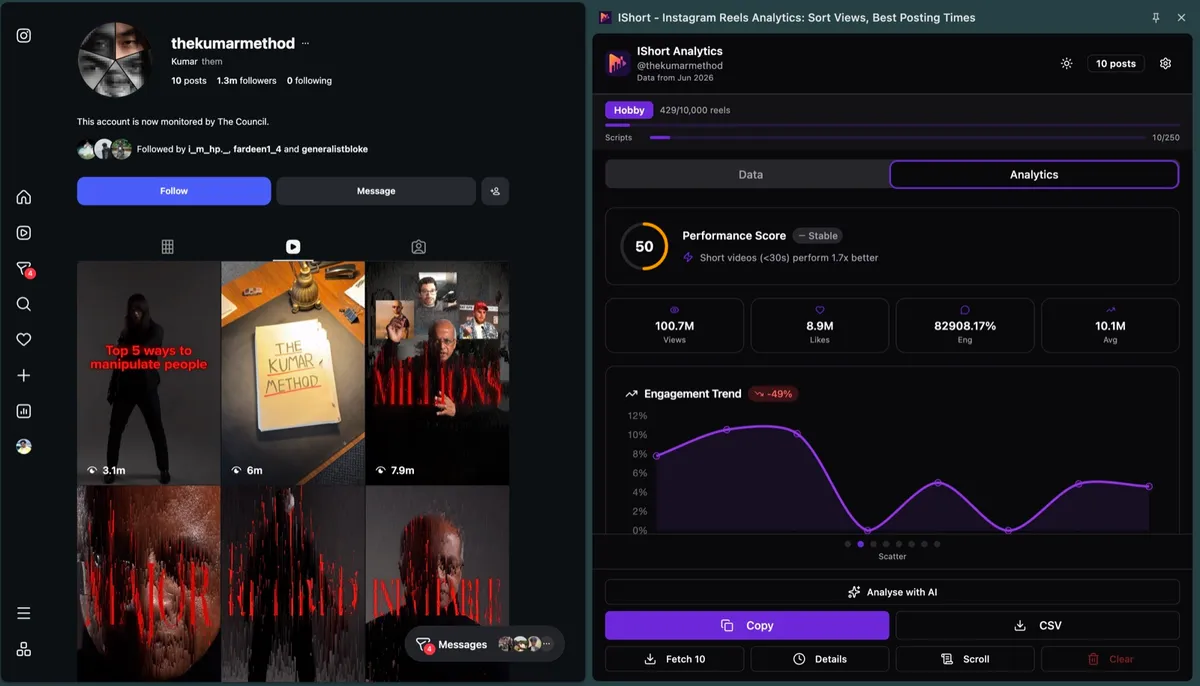
Slide 1: Performance Overview

The Performance Overview is your at-a-glance summary of how your Reels are performing. This slide includes:

Performance Score (0-100)

The Performance Score is a composite metric that evaluates your overall Instagram Reels performance. It's displayed as a large circular progress indicator (similar to a speedometer) and considers:

  • Average Views - Higher average views increase your score
  • Engagement Rate - Likes and comments relative to views
  • Posting Consistency - Regular posting frequency boosts the score
  • Week-over-Week Growth - Improving metrics raise the score

The score is color-coded:

  • 0-40 (Red) - Needs Improvement
  • 41-60 (Yellow) - Average
  • 61-80 (Green) - Good
  • 81-100 (Dark Green) - Excellent

Week-over-Week Trend

Below the Performance Score, you'll see a percentage change indicator showing how your performance has changed compared to the previous week. For example, "+12.3%" means your overall performance improved by 12.3% this week.

Top Insight

IShort automatically highlights your most important insight from the data. Examples:

  • "Your Reels posted on Thursday at 6-9 PM get 2.3x more views than average"
  • "Reels under 30 seconds outperform longer Reels by 47%"
  • "Your engagement rate dropped 8% this week—try posting more engaging hooks"

Key Metrics Grid

Four key metrics are displayed in a 2x2 grid:

  • Total Views - Sum of all views across collected Reels
  • Total Likes - Sum of all likes
  • Average Engagement Rate - Mean engagement % across all Reels
  • Average Views - Mean views per Reel

Engagement Trend Line Chart

A line chart shows your engagement rate over the last 30 Reels (or date range). This helps you spot trends—are you improving, plateauing, or declining?

How to Use This Slide: Check your Performance Score weekly to track overall progress. If the score drops, drill into other slides (like Best Posting Times or Duration Insights) to identify the root cause.

Slide 2: Views vs Engagement Scatter Plot

This interactive scatter plot visualizes the relationship between views and engagement rate for all your Reels. Each dot represents one Reel, positioned according to its views (X-axis) and engagement rate (Y-axis).

Instagram Reels analytics dashboard — Views vs Engagement scatter plot labelling reels as Stars, Potential and Improve
The Views vs Engagement scatter plot in IShort — green Stars, yellow Potential, red Improve.

Three Performance Categories

Reels are color-coded into three categories:

  • High Performers (Green) - Above-average views AND above-average engagement
  • Mid Performers (Yellow) - Either above-average views OR above-average engagement (but not both)
  • Low Performers (Red) - Below-average views AND below-average engagement

The chart includes quadrant lines showing your average views and average engagement rate. This divides the scatter plot into four regions:

  • Top-Right (Green) - High views, high engagement (your best content)
  • Top-Left (Yellow) - Low views, high engagement (underexposed quality content)
  • Bottom-Right (Yellow) - High views, low engagement (viral but not engaging)
  • Bottom-Left (Red) - Low views, low engagement (underperformers)

Hover Tooltips

Hover over any dot to see a tooltip with the Reel's caption, exact views, exact engagement rate, and post date. Click a dot to open the detailed insights modal for that Reel.

Why This Matters

This scatter plot helps you identify:

  • Underexposed gems - Reels with high engagement but low views (algorithm didn't push them). Consider reposting or promoting these.
  • Empty viral content - Reels with high views but low engagement. These got reach but didn't resonate. Avoid this content style. (Confused by reach vs views? See what does accounts reached mean on Instagram for the exact definition the dashboard uses.)
  • Consistency gaps - A tight cluster means consistent performance. Scattered dots mean unpredictable results—you haven't found your formula yet.

Pro Tip: Your goal is to move more dots into the top-right (green) quadrant. Analyze your high performers to understand what makes them successful, then replicate those patterns.

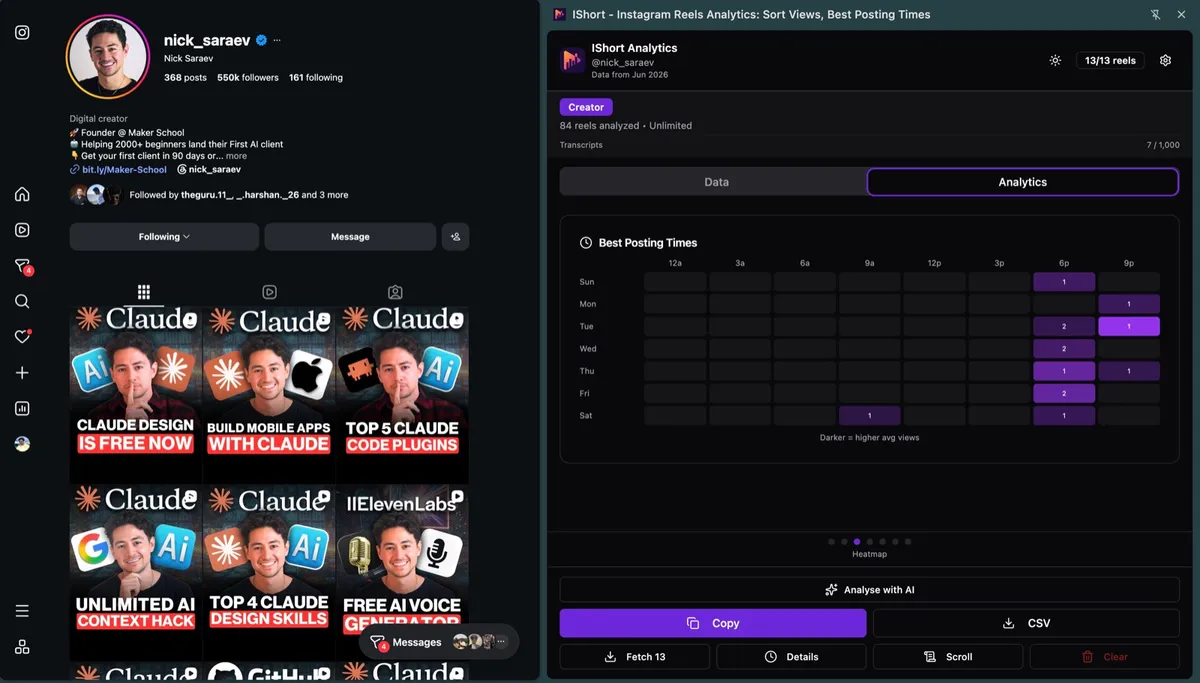
Slide 3: Best Posting Times Heatmap

The Best Posting Times heatmap is one of IShort's most popular features. It shows you exactly when to post Reels for maximum views.

Instagram Reels best posting times heatmap by day and hour, where darker cells mean higher average views
Best Posting Times heatmap — darker cells = higher average views for that day and hour.

Heatmap Structure

The heatmap is a 7x8 grid:

  • Rows (7) - Days of the week (Monday through Sunday)
  • Columns (8) - 3-hour time blocks (12-3 AM, 3-6 AM, 6-9 AM, 9 AM-12 PM, 12-3 PM, 3-6 PM, 6-9 PM, 9 PM-12 AM)

Each cell is color-coded based on the average views for Reels posted in that time block. Darker colors indicate higher average views. Light colors indicate lower average views.

How It's Calculated

IShort analyzes the post time and view count for every Reel you've collected. It groups them by day of week and 3-hour time block, then calculates the average views for each group. For example:

  • If you posted 5 Reels on Thursday between 6-9 PM and they averaged 15,000 views, that cell gets a dark color.
  • If you posted 3 Reels on Monday between 3-6 AM and they averaged 2,000 views, that cell gets a light color.

Hover Tooltips

Hover over any cell to see the exact average views for that time slot, plus the number of Reels posted in that slot. This helps you gauge statistical significance—a cell with 1 Reel is less reliable than one with 10 Reels.

How to Use This Data

Your best posting time is the darkest cell on the heatmap. Schedule your most important Reels for that time slot. If you see a clear pattern (e.g., evenings outperform mornings), adjust your posting schedule accordingly.

Keep in mind:

  • Sample size matters - If you've only posted 5 Reels total, the heatmap isn't very reliable. Aim for at least 20-30 Reels for meaningful insights.
  • Algorithm changes - Instagram's algorithm evolves. Revisit the heatmap every few months to check if your best times have shifted.
  • Audience location - If your audience is global, you might see multiple good time slots (e.g., morning US East Coast + evening Europe).

Action Step: Find your darkest cell and schedule 3-5 Reels for that time slot over the next two weeks. Track whether views improve compared to your average posting time.

Slide 4: Hashtag Performance

The Hashtag Performance slide shows a horizontal bar chart of your top hashtags ranked by the views they drove.

Instagram Reels hashtag performance bar chart ranking each hashtag by total views
Hashtag Performance ranks every tag by the views it actually generated.

What's Included

For each hashtag, you see:

  • Average Views - Mean views for Reels that used this hashtag
  • Average Engagement Rate - Mean engagement % for Reels with this hashtag
  • Usage Count - How many Reels used this hashtag

How to Interpret the Data

A hashtag with high average views and high usage count is a proven winner. Use it consistently.

A hashtag with high average views but low usage count might be a hidden gem—or it might just be noise (e.g., you only used it once on a viral Reel). Test it a few more times to confirm.

A hashtag with low average views and high usage count is dragging down your performance. Stop using it.

Hashtag Strategy Tips

  • Mix broad and niche hashtags - Broad hashtags (e.g., #fitness) reach more people but have lower engagement. Niche hashtags (e.g., #kettlebellworkout) reach fewer people but higher engagement.
  • Avoid oversaturated hashtags - If a hashtag has 100M+ posts, your Reel will get buried. Stick to hashtags with 10K-1M posts for better discoverability.
  • Test and iterate - Try new hashtags on every 3rd or 4th Reel. After 20-30 Reels, check which new hashtags outperformed your baseline.

Slide 5: Best & Worst Performers

This slide shows side-by-side cards: your single best-performing Reel on the left, and your single worst-performing Reel on the right.

What's Displayed

For each Reel, you see:

  • Thumbnail preview
  • Caption snippet
  • Views, likes, comments
  • Engagement rate
  • Duration
  • Post date

Why This Comparison Matters

Seeing your best and worst content side-by-side makes it easy to spot differences. Ask yourself:

  • What's different about the hook (first 3 seconds)?
  • Is one significantly shorter or longer?
  • Does one use trending audio while the other uses original?
  • Is one posted at a better time of day?
  • Does the caption on the best performer ask a question or prompt engagement?

These comparisons often reveal patterns that aren't obvious when you're scrolling through dozens of Reels.

Slide 6: Duration & Audio Insights

This slide breaks down your Reels performance by video duration and audio type.

Instagram Reels duration and audio performance — engagement by short, medium and long reels and original vs licensed audio
Duration & Audio insights — which reel length and audio type earn the most engagement.

Duration Breakdown

Your Reels are grouped into three buckets:

  • Short (Under 30 seconds) - Average views, average engagement, count
  • Medium (30-60 seconds) - Average views, average engagement, count
  • Long (60+ seconds) - Average views, average engagement, count

A bar chart visualizes the average views for each duration bucket. This tells you at a glance whether shorter or longer Reels perform better for your account.

In most niches, shorter Reels (under 30 seconds) outperform longer ones because they have higher completion rates. But some niches (e.g., tutorials, recipes, storytelling) benefit from longer formats. The data will tell you which works for your audience.

Audio Type Breakdown

Your Reels are also grouped by audio type:

  • Original Audio - Reels where you recorded your own voiceover or used no audio
  • Licensed Music - Reels using Instagram's music library or trending sounds

For each type, you see average views, average engagement, and count.

Generally, Reels with trending audio get more reach because Instagram's algorithm favors audio trends. However, original audio can perform well if it's highly engaging (e.g., funny commentary, unique voiceover style) — our guide on original audio vs trending sounds on Instagram breaks down exactly when each one wins.

Optimization Strategy: If your short Reels outperform long ones by 2x or more, prioritize creating content under 30 seconds. If licensed music consistently beats original audio, spend more time finding trending sounds before recording.

Slide 7: Quick Tips

The Quick Tips slide is available on every plan. It displays 4 AI-generated tips based on your data:

1. Best Posting Hour

Example: "Post between 6-9 PM on Thursdays for 2.3x more views"

This tip is derived from your Best Posting Times heatmap. IShort identifies the single highest-performing time slot and recommends it.

2. Best Duration

Example: "Your Reels under 30 seconds get 47% more views—keep it short!"

This tip compares your three duration buckets (short, medium, long) and recommends the one with the highest average views.

3. Audio Recommendation

Example: "Reels with licensed music outperform original audio by 31%"

This tip compares original audio vs. licensed music and tells you which performs better for your account.

4. Best Day of Week

Example: "Thursday is your best day—average views are 18% higher than other days"

This tip analyzes your views by day of week and identifies the highest-performing day.

How to Use These Tips

Treat these as starting points, not strict rules. Test the recommendations over 5-10 Reels and see if your metrics improve. If they do, double down. If they don't, revisit the data and look for other patterns.

Plan Tiers: What's Included?

Every feature is included on every plan — the full 7-slide dashboard, CSV export, viral score and AI tips. Paid plans simply raise your monthly limits.

Feature Free Hobby ($10/mo) Creator ($29/mo)
Reels analyzed / month 500 10,000 Unlimited
Full analytics dashboard (all 7 slides) Yes Yes Yes
Sort by Views, Likes, Comments, Date Yes Yes Yes
Hashtag Performance & Quick Tips Yes Yes Yes
CSV & clipboard export Yes Yes Yes
Viral Score (0-100) Yes Yes Yes
AI reel transcriptions / month 10 250 1,000
Competitor analysis (any public profile) Yes Yes Yes

Why Data-Driven Content Creation Matters

Most Instagram creators post based on gut feeling. They guess what content will work, post it, and hope for the best. When something goes viral, they can't explain why. When something flops, they don't know what went wrong.

Data-driven creators are different. They let their analytics guide their decisions:

  • They know their best posting time, so they schedule important content for that slot.
  • They know their best video length, so they optimize for it.
  • They know which hashtags drive views, so they use them consistently.
  • They know what audio type performs best, so they prioritize it.

This approach removes guesswork. Instead of posting randomly and hoping for virality, you post strategically based on what's already worked.

Bottom Line: Analytics turn content creation from gambling into a repeatable process. You can't control the algorithm, but you can control your inputs (timing, format, audio, hashtags). IShort gives you the data to optimize those inputs.

Access Your Analytics Dashboard

Install IShort and unlock your full analytics dashboard. See your Performance Score, best posting times, hashtag insights, and AI-powered tips. Start with the free plan and upgrade anytime.

Install IShort Free

Instagram Reels Dashboard

What should an Instagram Reels dashboard actually show? At minimum, a useful Reels dashboard surfaces four core metrics at a glance: total views across all Reels, average engagement rate, best-performing Reel by views, and a posting-frequency timeline showing your publishing cadence. Beyond those basics, a high-utility Reels dashboard adds drill-down views for hashtag performance, audio type comparison (original vs. trending), and a posting-time heatmap that maps your account's peak engagement windows.

The native Instagram Reels dashboard inside the IG app shows limited data — usually just per-Reel views, likes, and reach, with no aggregate trends and no comparison views. A creator-focused dashboard like IShort's fills that gap with sortable tables (rank your top 100 Reels by 12+ metrics), engagement scatter plots, and AI-generated insight tips that flag underperformers and highlight winners worth replicating. If you also publish on other surfaces, a creator-side dashboard is the only way to do an apples-to-apples Reels vs TikTok vs Shorts comparison across the same video.

IShort Instagram Reels analytics dashboard — Performance Overview slide with Performance Score, key metrics and engagement trend chart
The Performance Overview slide — Performance Score, key metrics and engagement trend at a glance.

See a free Instagram Reels dashboard walkthrough.

Frequently Asked Questions

Is IShort's analytics dashboard free?

Yes — IShort's Instagram Reels analytics dashboard is free, with the full 7-slide dashboard and CSV export for up to 500 reels/month. Hobby ($10/mo) raises the limit to 10,000 reels/month; Creator ($29/mo) is unlimited. Below: full slide breakdown.

What is a Performance Score?

A Performance Score (0-100) is a composite metric for Instagram Reels combining average views, engagement rate, posting consistency, and week-over-week growth. Color-coded: 0-40 red, 41-60 yellow, 61-80 green, 81-100 dark green. Below: how to lift it.

How does the posting time heatmap work?

The posting time heatmap works by grouping all your Reels into 3-hour time blocks (e.g., 6-9 PM) and calculating average views per block. Darker cells = stronger slots. Hover to see exact views and post count. Below: how to spot underused windows.

Can I use the analytics dashboard for competitor analysis?

Yes. IShort's analytics dashboard works on any public Instagram profile. You can analyze competitor accounts to see their best posting times, top-performing content, hashtag strategies, and whether they use original or licensed audio. This is valuable for competitive research and benchmarking.

How often should I check my analytics?

Check your Performance Score and engagement trend weekly to track overall progress. Review the Best Posting Times heatmap monthly to see if your optimal posting window has shifted. Analyze Hashtag Performance after every 20-30 Reels to identify winners and losers. Check Duration & Audio Insights quarterly to spot long-term trends.

Do I need a lot of Reels for the analytics to be useful?

IShort works with any number of Reels, but the insights become more reliable with larger sample sizes. For the Best Posting Times heatmap, aim for at least 20-30 Reels so each time slot has enough data. For Hashtag Performance, you need at least 3-5 Reels per hashtag to draw meaningful conclusions. Start small and the accuracy improves over time as you post more.

Can I export my analytics data?

Yes. Every plan, including Free, can export all collected Reel data to CSV with one click. The exported file includes URL, caption, views, likes, comments, engagement rate, duration, post date, hashtags, mentions, audio type, and more. Perfect for creating custom reports or deeper analysis in Excel/Google Sheets.

Does the dashboard update in real-time?

The dashboard updates whenever you collect new Reels. If you revisit a profile and scroll to load more Reels, the analytics recalculate automatically. This means you can track changes over time by revisiting profiles weekly or monthly.

Do I need to log in to Instagram to use the dashboard?

No. IShort works without your Instagram login — it reads public reel data from the page you're viewing and stores it locally in your browser. You sign in to IShort with Google; it never asks for your Instagram credentials.

Start Using the IShort Analytics Dashboard

If you're serious about growing on Instagram, you need to understand what content works. And you can't understand what works without analytics.

IShort's analytics dashboard gives you everything you need to make data-driven decisions: performance scores, engagement trends, posting time heatmaps, hashtag insights, and AI-powered tips.

Install it today and see your analytics in minutes.

Get Started with IShort

The Free plan includes the full dashboard (all 7 slides), CSV export and AI tips for 500 reels/month. Hobby ($10/month) raises that to 10,000 reels/month; Creator ($29/month) is unlimited.

Install Free Now
Summarize with AI: Claude ChatGPT Share